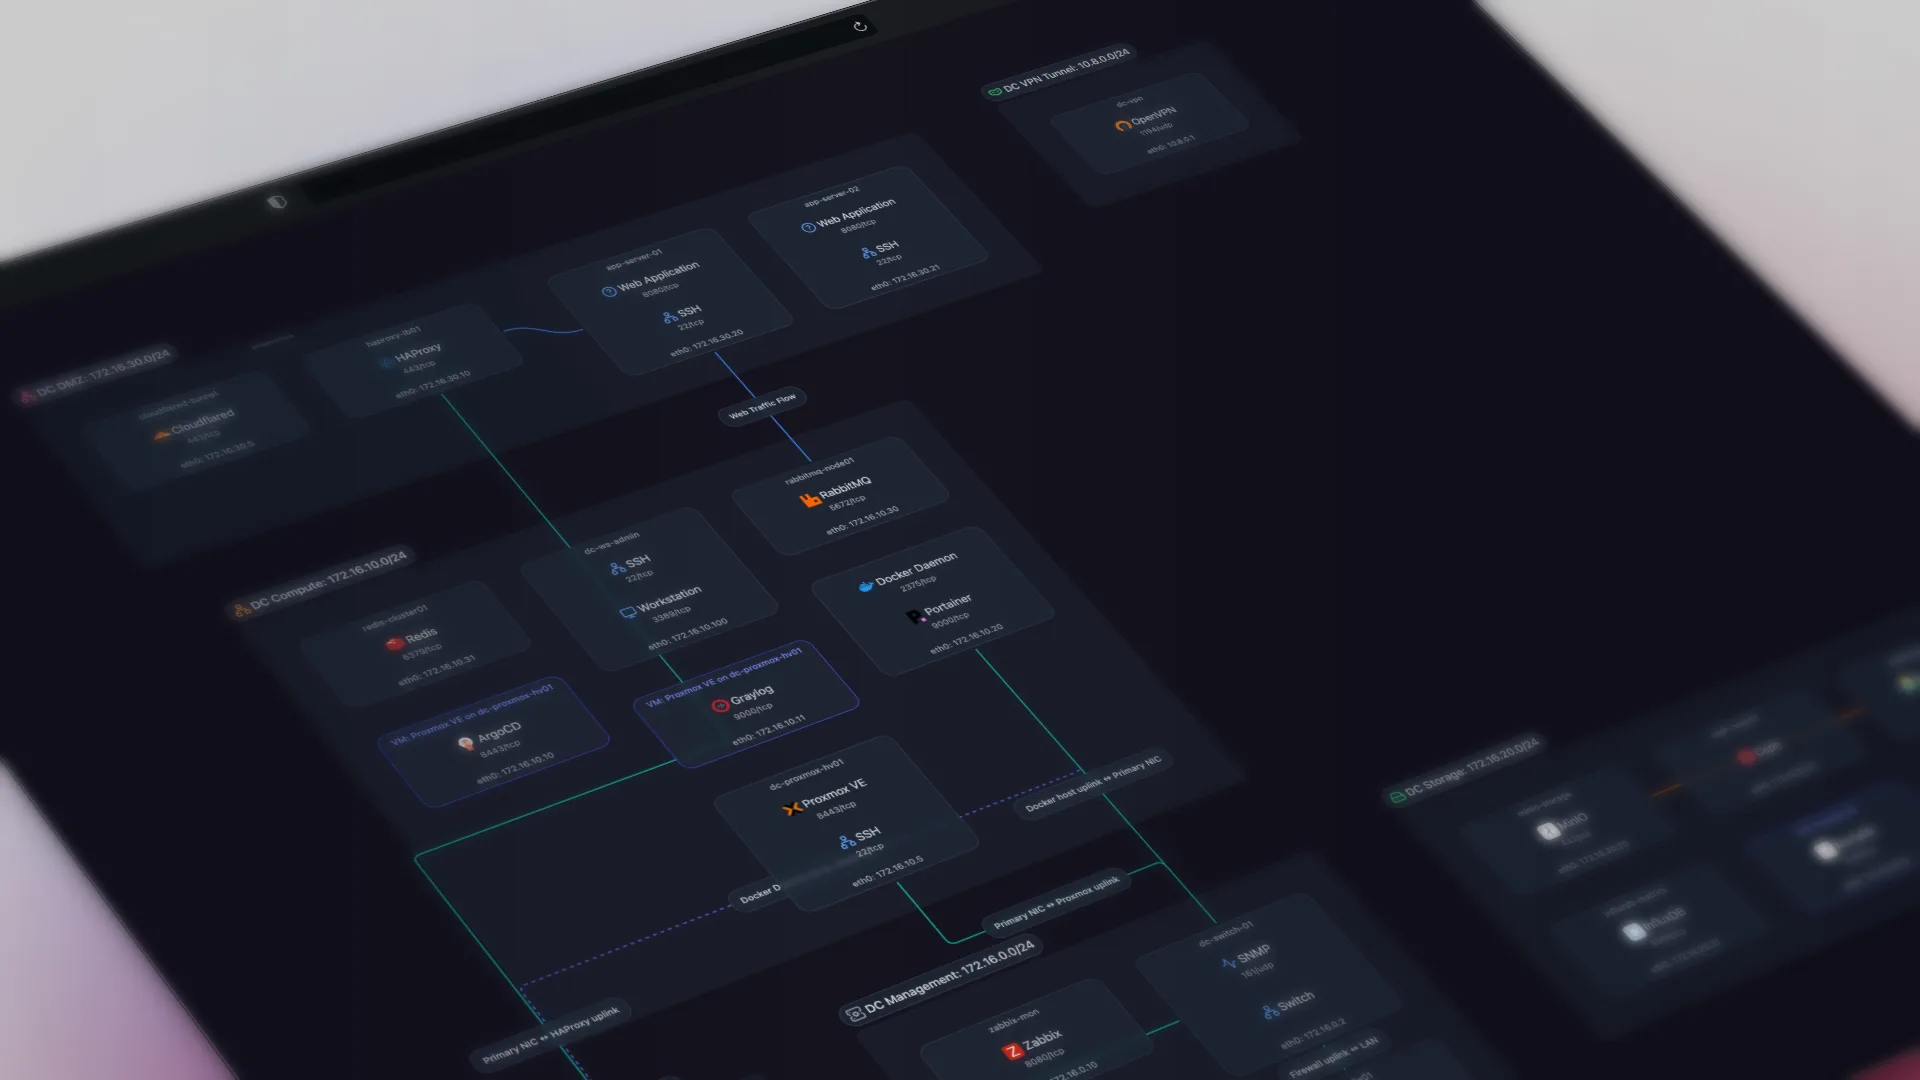
TL;DR: The best network documentation tool for most IT teams combines automatic discovery with an exportable, shareable map, not a monitoring dashboard with a map tab bolted on. Most tools marketed as 'automated' are either monitoring platforms that include mapping as a feature, or manual drawing tools with no discovery. Here's what each of the 13 tools does, what it costs, and which one fits your network.
Network Documentation Tools Fall Into Three Categories: Monitoring Platforms, Dedicated Tools, and Manual Drawing Tools
There are three categories of network documentation tools: monitoring platforms that include mapping as a feature, dedicated documentation tools that focus only on documenting the network, and manual diagramming tools where you draw everything yourself. The right choice depends on whether you need monitoring bundled in, how often the documentation needs to update, and your budget. If you think of this as building a live map rather than a static diagram, see our network mapping software guide.
| Scenario | Recommendation |
|---|---|
| MSP managing client networks | Auvik if you want monitoring bundled in (per-device pricing scales with your client base). Scanopy if you want documentation decoupled from monitoring (flat pricing regardless of host count). Head to head: Scanopy vs Auvik. |
| Documentation independent from monitoring | Scanopy gives you a living, interactive map with flat pricing. SolarWinds NTM auto-populates Visio SmartShapes on export, which Scanopy does not. See Scanopy vs SolarWinds NTM. |
| Large enterprise with automation needs | NetBrain. Its maps tie into troubleshooting runbooks and automation playbooks; no other tool on this list does. See Scanopy vs NetBrain. |
| Diagrams bundled with monitoring | If you already use Auvik, PRTG, Domotz, or ManageEngine for monitoring, use their built-in mapping. |
| One-time diagram for a presentation or project | draw.io or Lucidchart. Draw it once, export it, done. draw.io is free. Lucidchart supports real-time multi-cursor editing and inline commenting. |
| Budget monitoring + mapping | Domotz ($1.50/device/mo) or ManageEngine ($95/yr) |
| Free and self-hosted | LibreNMS for monitoring with basic maps. NetDisco for Layer 2 topology discovery. Scanopy Community Edition for documentation-focused mapping. draw.io for manual diagrams. All free. |
A Network Documentation Tool Answers Three Questions and Keeps the Answers Current
Good network documentation software keeps the answers to three questions accurate as the network changes:
- What is on the network? Hosts, their IP and MAC addresses, hostnames, and vendors. The deeper tools also fingerprint the services running on each host, so a box isn't just an IP, it's "the machine running Postgres, Nginx, and a stack of containers."
- How is it connected? Physical links between switches, routers, and hosts, plus the logical layer of subnets and VLANs. This is the part manual diagrams get wrong first, because cabling and topology change without anyone updating the drawing.
- What changed? A record you can trust over time, not a file someone last touched eighteen months ago.
The output is usually a topology map plus a searchable inventory. A documentation tool derives that data from discovery; a drawing tool derives it from memory.
"Automated" Means the Tool Discovers the Network and Documents It for You
"Automated" means the tool discovers your network and produces the documentation without you drawing anything. Most tools on this list do that. draw.io and Lucidchart don't. They're manual diagramming tools, included because they are commonly recommended for this query. (Here's a deeper look at how automated network documentation works, and for the free, self-hosted options specifically, the open-source network documentation guide.)
- SNMP (Simple Network Management Protocol)
- The primary protocol used by network diagram tools to query devices for identity, interface, and neighbor data. Most tools on this list require SNMP to be enabled on managed devices.
- LLDP (Link Layer Discovery Protocol)
- A vendor-neutral protocol in which devices transmit identity and capability information to directly connected neighbors. Used by diagram tools to map physical Layer 2 topology.
- CDP (Cisco Discovery Protocol)
- Cisco's proprietary equivalent of LLDP. Many diagram tools support both CDP and LLDP to discover neighbor relationships on mixed-vendor networks.
- Layer 2 vs Layer 3 topology
- Layer 2 maps show physical switch-to-switch connections and VLAN assignments. Layer 3 maps show IP subnets and routing relationships. Some tools produce both from a single scan.
- Service discovery
- Identifying what software or services (web servers, databases, DNS) are running on each host, beyond just detecting that the host exists. Nmap and Scanopy perform deep service fingerprinting; most other tools on this list do not.
Documentation, Monitoring, and ITAM Are Not the Same Thing
This category gets muddy because three different kinds of tools all touch your device inventory. They are not substitutes, and several tools on this list are really monitoring platforms with a map feature.
| Tool type | Core job | Priced for |
|---|---|---|
| Network documentation | Keep an accurate map and inventory of what exists and how it connects | Completeness (whole network) |
| Network monitoring | Watch device health, alert on problems, track performance over time | Per-device attention |
| IT asset management (ITAM) | Track ownership, lifecycle, licensing, and procurement of assets | Asset records |
Most teams need more than one of these. Documentation software tells you the network's shape; monitoring tells you when part of it is on fire; ITAM tells you who owns the laptop and when its warranty ends. The right setup runs them alongside each other, not one instead of another.
Per-Device Pricing Makes Complete Documentation the Most Expensive Option
Per-device pricing fits monitoring because monitoring's value is per-device, and it can be tuned to match. You watch critical devices closely and can sample, throttle, or skip the rest, so paying in proportion to what you actively monitor lines up with the value you get (and with the cost, since continuous polling, storage, and alerting scale per device).
Documentation works the opposite way. Its value is in completeness. A diagram that covers 80% of your devices isn't 80% as useful, it's close to useless, because the undocumented 20% is where the outage will be. You can't sample documentation by criticality the way you can monitoring, so per-device pricing makes complete coverage the most expensive option, and incomplete coverage is what makes documentation fail.
That's why Scanopy prices flat regardless of host count. Keeping documentation priced independently also means you can switch monitoring platforms without losing your maps.
Most Tools Render One or Two of the Four View Types. Few Render All Four.
The table breaks each tool down by which views it actually renders: Layer 2 physical (switch-to-switch) topology, Layer 3 logical (IP subnet and routing) mapping, workload (VM and container) nesting, and application dependency maps.
| ToolProduct name and link to vendor site | DiscoveryProtocols used to find devices and map connections | Network ViewsWhich topology views the tool produces from discovery. L2 Physical switch ports and links L3 Subnets, VLANs, routing Workload VM/container host nesting Application Service-dependency / app grouping Yes supported Tag ? unverified Greyed not supported | EnvironmentsWhere the tool discovers/maps: on-prem and/or public cloud (AWS, Azure, GCP). | ServicesNo No service awareness Basic Common port detection Yes Application-level fingerprinting | Live UpdatesWhether diagrams update automatically after the initial scan | Open SourceOSI OSI-approved open source license Source available Source code available, restricted license No Proprietary | PricingStarting price or pricing model | Also IncludesCapabilities beyond network diagramming |
|---|---|---|---|---|---|---|---|---|
| Dedicated Diagram Tools | ||||||||
| Scanopy | SNMP LLDP CDP ARP TCP/UDP | Yes240+ types | Yes | OSI AGPL-3.0 | Starts at $11.99 monthly, unlimited hosts | Docker Visualization | ||
| SolarWinds NTM | SNMP WMI CDP LLDP ICMP [3] | No | Yes | No | Perpetual ~$1,570 (subscription shift unclear) [44] | — | ||
| NetBrain | SNMP CDP LLDP ARP SSH/CLI | [21] | No | Yes | No | Enterprise (contact sales) | — | |
| Faddom | NetFlow/sFlow [23] | Basicapp dependencies [23] | Yes | No | Free up to 50 servers then from $19,000/yr [24] | — | ||
| Monitoring Platforms with Diagrams | ||||||||
| Auvik | SNMP CDP LLDP ARP [1] | [20] | Basic [2] | Yes | No | Per-device (contact sales) | Monitoring Traffic Analysis | |
| PRTG | SNMP WMI ICMP [13] | No | Yes | No | Free up to 100 sensors then tiered [4] | Monitoring Traffic Analysis | ||
| Domotz | SNMP ARP ICMP CDP LLDP mDNS NetBIOS [5] | Basic [6] | Yes | No | $1.50/device/mo [7] | Monitoring RMM | ||
| ManageEngine OpManager | SNMP CDP LLDP ARP [8] | No | Yes | No | From $95/yr (10 devices) [9] | Monitoring | ||
| Discovery Tools | ||||||||
| Nmap + Zenmap | ICMP ARP TCP/UDP | Yes | No | Source available NPSL | Free | — | ||
| LibreNMS | SNMP CDP LLDP [10] | No | No | OSI GPL-3.0 | Free | Monitoring | ||
| NetDisco | SNMP CDP LLDP ARP [12] | No | Yes | OSI BSD | Free | — | ||
| Manual Diagramming | ||||||||
| draw.io | No | — | No | No | OSI Apache-2.0 | Free | — | |
| Lucidchart | No | [22] | No | No | No | From $9/user/mo [11] | — | |
Scanopy is our product. Vendor details are sourced from official documentation, published pricing, and community reports as of June 2026. Features, pricing, and capabilities may have changed since publication. Check each vendor's website for the latest information.
Monitoring Platforms with Diagrams
These are monitoring tools first. Network diagrams come included as part of the monitoring package. If you already use one of these for monitoring, the built-in mapping may be all you need. If you use a different monitoring stack, or want documentation that isn't tied to your monitoring vendor, a dedicated tool gives you more flexibility.
Auvik
The strongest option for MSPs who want monitoring and network maps in one platform. Auvik is cloud-managed network monitoring that discovers devices via SNMP, CDP, LLDP, and ARP, then builds real-time topology maps that update continuously.
Best for: MSPs who need monitoring, alerting, and network maps in one cloud-managed platform
Discovery: SNMP, CDP, LLDP, ARP. NetFlow for traffic analysis. Cloud-hosted with an on-site collector agent. Discovers across AWS, Azure, and GCP via cloud APIs alongside on-prem SNMP/LLDP.
Network views: Discovers VMs and containers and shows them as nodes on the L2/L3 map, but no host-to-VM nesting view (VM detail lives in a monitoring dashboard). [37] [39]
Diagrams: Interactive topology maps with real-time updates and Layer 2/3 views. Auto-discovered topology renders at both layers, updates as devices change state, and stays readable in larger environments.
Pricing: Per-device (contact sales). Auvik does not publish pricing. Multiple device categories (network infrastructure, endpoints, servers) are charged at different rates, so current pricing requires a quote.
Deployment: Cloud-hosted SaaS. One collector deployed per network site forwards data to Auvik's platform. No software on monitored devices.
Where it fits: If you're an MSP that needs monitoring, alerting, config backup, and network maps in one platform, Auvik is a strong option. Auvik renders L2 and L3 with device grouping and live link status.
Trade-off: Documentation is coupled to Auvik's per-device pricing and platform. If you already run a different monitoring stack (LibreNMS, Zabbix, PRTG), adding Auvik for diagrams means paying for monitoring capabilities you already have.
PRTG Network Monitor
Best for teams already running Paessler for monitoring who want built-in mapping. PRTG is a full monitoring stack with auto-discovery and interactive maps, released in 2003 and with a large installed base. PRTG counts sensors, not devices: most users average 10 sensors per device, so a 1,000-sensor license typically covers around 100 devices.
Best for: Teams already invested in the Paessler ecosystem who want built-in topology mapping alongside monitoring
Discovery: SNMP, WMI, ICMP. NetFlow and packet sniffing for traffic analysis. Self-hosted on Windows.
Network views: No native auto L2/L3; automatic L2 maps require the third-party UVexplorer add-on. [32]
Diagrams: 2D and 3D maps generated from discovery data.
Pricing: Free up to 100 sensors then tiered. Not 100 devices - a single device can use multiple sensors.
Deployment: Self-hosted on Windows Server 2016+. PRTG Hosted Monitor available as cloud alternative. Core server with optional remote probes for distributed monitoring.
Where it fits: If you already use PRTG for monitoring and want basic topology visibility, the built-in maps avoid adding another tool. The maps show what PRTG discovers, which is thorough.
Trade-off: Mapping is secondary to monitoring. The diagram feature exists to visualize what PRTG monitors, not to produce shareable documentation.
ManageEngine OpManager
Best budget option for mid-market teams that want monitoring and topology maps at a fraction of Auvik's per-device cost. OpManager provides agentless network monitoring with Layer 2/3 auto-discovery and topology maps, plus rack and floor plan views that most monitoring tools lack. Scales up to 30,000 devices with a distributed monitoring architecture.
Best for: Mid-market IT teams that want monitoring and visualization at a lower per-device cost
Discovery: SNMP, CDP, LLDP, ARP. Auto-maps port-level connectivity.
Network views: Host-to-VM and VM-to-datastore virtualization maps. [27] [38]
Diagrams: Topology maps, rack views, floor plan views. More visualization options than most monitoring tools.
Pricing: From $95/yr (10 devices). Professional from $145/year. Free edition available (3 devices).
Deployment: Self-hosted on Windows or Linux. Agentless: the central server polls devices via SNMP, WMI, CLI.
Where it fits: Mid-market teams that want monitoring and visualization in one tool at a lower per-device cost than Auvik. OpManager also renders rack and floor-plan views, which most monitoring tools do not.
Domotz
The lowest published per-device price of the monitoring platforms with network maps. Domotz offers remote monitoring and management with network mapping, positioned as a lower-cost Auvik alternative. A single collector deployed to the client's network provides a real-time inventory within minutes. No endpoint agents required.
Best for: Cost-conscious MSPs who need monitoring, remote access, and basic network maps at a published price
Discovery: SNMP, ARP, ICMP, CDP, LLDP, mDNS, NetBIOS. Cloud-hosted with an on-site agent.
Network views: L2 map confirmed; L3/VLAN mapping is not documented in Domotz help docs. [29]
Diagrams: Auto-generated topology maps. The focus is remote access and monitoring, with mapping as a supporting feature.
Pricing: $1.50/device/mo. Free tier covers 1 managed device with unlimited discovery. Published per-device rates.
Deployment: Cloud-hosted SaaS. One collector per network, running on Linux, Raspberry Pi, Docker, or NAS. No endpoint agents.
Where it fits: MSPs who want monitoring, remote access, and basic network mapping at a low per-device rate. Domotz publishes its pricing at $1.50/device/month.
Trade-off: Diagrams are secondary to remote access and monitoring. If documentation is your primary goal, the mapping features may not go deep enough.
Dedicated Diagram Tools
These exist specifically to discover and map networks or the applications running on them. Not monitoring platforms. No alerting, no traffic analysis, no config backup. Their entire purpose is producing accurate diagrams.
SolarWinds Network Topology Mapper
Best for organizations that need compliance-ready Visio exports. NTM scans your network and generates topology diagrams exportable to Visio, PDF, and PNG. It is a standalone Windows application, separate from the SolarWinds Observability platform.
Best for: Enterprise teams that standardize on Microsoft tools and need Visio-native network diagram exports
Discovery: SNMP, WMI, CDP, LLDP, ICMP. Scan-on-demand (not continuous). Supports scheduled scans. Also discovers VMware and Hyper-V environments.
Network views: L2 and L3 diagrams from a single scan. [3]
Diagrams: Multiple diagram types from a single scan (Layer 2, Layer 3, physical). Exports to Visio with auto-populated SmartShapes, plus PNG, PDF, and the SolarWinds Orion Network Atlas format. No SVG, no Mermaid, no embeddable or iframe output, and no API access to the map data. NTM is a standalone product that cannot be installed on the same server as the SolarWinds Platform, and its Network Atlas export is one-way.
Pricing: Perpetual ~$1,570 (subscription shift unclear). SolarWinds moved to subscription-only licensing across its product line in 2025. Renewal prices have reportedly increased significantly post-acquisition by Turn/River Capital.
Deployment: Windows desktop application. Requires .NET 3.5 and 4.8. No web interface, no cloud option. Scans from the machine it's installed on.
Where it fits: Enterprise teams that need compliance-ready documentation with Visio exports. The Visio export alone makes it the default choice in organizations that standardize on Microsoft tools.
Trade-offs: Requires Windows (.NET 3.5 and 4.8). No web-based access, no embeddable maps, no API. NTM has received only maintenance updates since roughly 2016, with no new discovery or mapping features. SolarWinds staff confirmed in 2017 that there is no product roadmap, and NTM 2.2.x reaches full end-of-life in September 2026. Active development has shifted to SolarWinds Observability, whose NPM module carries its own topology views. NTM holds a 4.1 out of 5 on G2, where the most common request is exactly this integration; the product still works, but reviewers cite the lack of new features as the reason they look elsewhere. SolarWinds disclosed a supply-chain compromise in 2020, though NTM is a separate, much simpler product.
Scanopy
Scanopy is our product. It is an automated network documentation tool built for IT teams that need living network maps that work alongside their monitoring platform. It deploys a lightweight daemon that discovers your network and builds an interactive topology map that updates on a schedule. A single scan produces four views you can switch between: L2 physical, L3 logical, workloads, and applications.
Best for: IT teams and MSPs who want a dedicated network diagram automation tool which works alongside their existing monitoring platform
Discovery: SNMP, LLDP, CDP, ARP, TCP/UDP. One daemon per network. No agents on endpoints, no SSH credentials. SNMPv1, v2c, and v3 (AuthPriv) are all supported, with credentials applied network-wide or pinned per host.
Service discovery: Beyond mapping devices and connections, Scanopy fingerprints 240+ service types per host: databases, web servers, DNS, DHCP, Docker containers, print services, and more. Most network mapping tools report only that a host is reachable at an IP address. Scanopy reports the services running on it. When you click a host on the topology map, you see every detected service, not just the host itself.
Diagrams: One scan produces four interactive views you can switch between: L2 physical (switch ports and links), L3 logical (subnets and routing), workloads (Docker containers and what they run), and applications (services grouped into the apps they belong to). Topology snapshots version your network state over time, so you can see what changed between scans. Shareable via a read-only link that stays current as the network rescans (no per-seat licensing). Embeddable via iframe. Exportable as PNG, SVG, PDF, HTML, Mermaid, Confluence, and CSV.
Pricing: Starts at $11.99 monthly, unlimited hosts. Free self-hosted Community edition available.
Deployment: Cloud-hosted SaaS or self-hosted via Docker. One daemon per network, with no agents on endpoints and no inbound firewall rules.
Where it fits: MSPs documenting client networks, IT teams that need documentation independent from their monitoring stack, and anyone who wants network maps without deploying another monitoring platform. Pairs well with whatever monitoring tool you already use.
What Scanopy doesn't do: Monitoring, alerting, traffic analysis, config backup, patch management, software license tracking. It's a documentation tool. If you need monitoring, use a monitoring tool alongside it.
This is a live Scanopy map you can interact with.
NetBrain
The only tool on this list built for large-scale network automation. Enterprise-grade dynamic network mapping with troubleshooting workflows. NetBrain maps are wired into its automation platform's runbooks and playbooks.
Best for: Large enterprises that need network maps integrated with automation and troubleshooting workflows
Discovery: SNMP, CDP, LLDP, ARP, SSH/CLI. Deep integration with network automation workflows. Discovers AWS VPC/EC2, Azure VNet/VM, and GCP VPC/VM with hybrid on-prem/cloud path mapping.
Network views: Virtualization maps (ESXi/vSwitch/VM) and application-path mapping, all on one dynamic map. [34] [35] [36]
Diagrams: Dynamic maps that tie into troubleshooting runbooks and automation playbooks. Maps can trigger actions, not just display data.
Pricing: Enterprise (contact sales). Not published.
Deployment: On-premises server or NetBrain-hosted cloud. Central server polls devices via SNMP and SSH/CLI, with no per-device agents.
Where it fits: Large, complex networks where diagrams aren't just documentation but part of the operational workflow. NetBrain handles networks with thousands of devices and integrates maps directly into troubleshooting runbooks and automation playbooks.
Trade-off: Overkill for anything smaller than a large enterprise. The pricing and complexity reflect that. Community experiences are polarized: some teams report excellent results, while others have struggled with map accuracy for years. One r/networking user spent two years and "hundreds of thousands of dollars" before abandoning it and reverting to manual Visio diagrams. A thorough PoC is essential before committing.
Faddom
Agentless application dependency mapping (ADM) for hybrid and multi-cloud infrastructure. Faddom builds real-time maps of how servers, applications, and services depend on each other, aimed at data center migration, cloud transition planning, and change management. Its headline claim is a first map in under 60 minutes, and reviews corroborate the fast time-to-value.
Best for: Enterprise IT teams mapping application dependencies for data center migrations and cloud transitions
Discovery: NetFlow/sFlow. Discovery is agentless and credential-free. Instead of polling devices, Faddom observes network traffic (NetFlow, sFlow, or a packet copy) to infer dependencies automatically. That means no agents to roll out, but it typically requires NetFlow/sFlow configuration or port mirroring, which needs network-team buy-in.
Network views: Application view is automatic, inferred from observed traffic (NetFlow/sFlow); does no network-layer L2/L3 topology. [23]
Service discovery: Faddom maps application dependencies (which services talk to which), not the device-level service fingerprinting that Scanopy or Nmap do. It enriches maps through integrations with Kubernetes and APM tools like Datadog.
Diagrams: Real-time application dependency graphs spanning on-prem, AWS, Azure, and GCP. It does not produce network-layer (Layer 2/3) topology: the focus is app-to-app relationships, not switch-port physical maps.
Pricing: Free up to 50 servers then from $19,000/yr. Pricing is public, which is rare in this category. A free Community tier covers up to 50 servers (described as "limited time access," so permanence is unclear). Paid plans start at $19,000/year for up to 300 servers (SMB tier) and scale to custom enterprise pricing. Modular: you pay for servers, modules, and users.
Deployment: Self-hosted appliance (on-prem or cloud), also available via the AWS, Azure, and GCP marketplaces. No per-host agents, but it needs access to network traffic.
Where it fits: Mid-to-large enterprise IT operations teams planning migrations or cloud moves who need an automatic picture of application dependencies without deploying agents. The public pricing and 50-server free tier make it evaluable without a sales process, which is unusual for ADM.
Trade-offs: ADM-only scope. No network-layer topology, no CMDB, ITAM, or service management (per third-party analysis). Native ITSM integrations are limited to ServiceNow and Splunk. Traffic capture requires NetFlow/sFlow configuration or port mirroring, and the $19,000/year floor puts it out of reach for SMB and mid-market budgets.
Manual Diagramming
These tools don't discover your network. You draw the diagram yourself. They are included here because they are commonly recommended for this query, and they are not automated diagram tools.
draw.io (diagrams.net)
The best free option for one-time, hand-drawn network diagrams. draw.io is an open-source diagramming tool with extensive network shape libraries, and the most widely used free alternative to Visio.
Best for: Anyone who needs a one-time, hand-crafted network diagram for a presentation or project
Discovery: You place shapes and draw connections manually. You can import from CSV or XML if you build the data pipeline yourself.
Network views: Manual diagramming only, no discovery.
Diagrams: Highly customizable. Huge icon libraries (Cisco, AWS, Azure, generic network). Export to everything. Works offline.
Pricing: Free.
Deployment: Browser-based at diagrams.net or desktop app (Electron: Windows, macOS, Linux). Confluence and Jira plugins available. No network interaction.
Where it fits: One-time diagrams, architecture documentation, presentations. If you need a diagram for a specific project or meeting and you're willing to draw it, draw.io is excellent.
The catch: The diagram is a snapshot of the moment you drew it. It won't update when your network changes. If you're looking for automated, continuously updated diagrams, draw.io isn't that. For a diagram of a network that does not exist yet, or a layout an auditor specifies, drawing it by hand is the only way to get it.
Lucidchart
Best for teams that need real-time collaboration on professional diagrams. Lucidchart is cloud-based diagramming with multi-user editing and imports infrastructure data from AWS, Azure, and GCP.
Best for: Teams that need polished, collaborative network diagrams for documentation or cloud architecture reviews
Discovery: No on-prem network scanning. Cloud architecture import via Lucidscale, which connects to AWS, Azure, and GCP accounts and auto-generates topology diagrams from live infrastructure.
Network views: Auto-views come only from the Lucidscale cloud import (AWS/Azure/GCP), not on-prem topology. [33]
Diagrams: Professional-grade output. Real-time collaboration. Extensive template library. Integrates with Google Workspace, Atlassian, Microsoft.
Pricing: From $9/user/mo. Free tier available (3 editable documents). Team plans from $9/user/month billed annually. See current pricing for latest rates.
Deployment: Cloud-hosted SaaS. Browser-based, no installation. Cloud import available for AWS/Azure/GCP topology via Lucidscale.
Where it fits: Teams that need polished, shareable diagrams for documentation, presentations, or cloud architecture reviews. Lucidchart supports real-time multi-cursor editing, inline commenting, and version history, and integrates with Confluence, Jira, Google Workspace, and Microsoft Teams.
The catch: Same as draw.io for on-prem networks: you're drawing the diagram, not discovering it. The cloud import feature is useful for AWS/Azure/GCP environments but doesn't help with physical networks, switches, or on-prem infrastructure.
Discovery Tools
LibreNMS
The best free self-hosted monitoring option, with limited mapping. LibreNMS is open-source network monitoring with auto-discovery. Topology mapping is secondary and manual: the legacy Weathermap plugin is deprecated (it does not run on supported PHP versions), so mapping uses the Custom Maps feature. Requires PHP 8.2+ and MariaDB on Linux. The central server polls devices via SNMP, with no per-device agents required.
Best for: Teams with Linux skills that want free, self-hosted monitoring with basic topology visualization
Discovery: SNMP, CDP, LLDP
Network views: L2 map built from xDP (CDP/LLDP) and ARP; no L3 subnet map. [30]
Diagrams: Topology visualization is a secondary feature. The legacy Network Weathermap plugin is deprecated and does not work on supported PHP versions, so LibreNMS points users to its Custom Maps feature, where the layout is placed by hand. New devices are not added to the map automatically.
Pricing: Free.
Deployment: Self-hosted on Linux (Ubuntu, Debian, CentOS). Docker available. Requires MariaDB and PHP 8.2+. The central server polls via SNMP, with no per-device agents.
Where it fits: Teams with Linux server management skills that want free monitoring with some topology visualization. If you're already running LibreNMS for monitoring, the weathermap plugin adds basic mapping without another tool.
Trade-off: Topology visualization is a community plugin, not a first-class feature. Setup requires Linux, PHP, and database administration. The monitoring side is strong; the diagramming side is minimal.
NetDisco
A long-established open-source network discovery tool. NetDisco is a web-based network management tool that discovers devices via SNMP and maps Layer 2 topology using CDP and LLDP neighbor data. Originally developed at the University of California, Santa Cruz, actively maintained since 2003.
Best for: Network teams that want free, open-source Layer 2 topology discovery and device tracking
Discovery: SNMP, CDP, LLDP, ARP. SNMP-based device discovery with CDP/LLDP neighbor detection and ARP/MAC table correlation. Tracks switch port usage, VLAN assignments, and device locations over time.
Network views: Layer 1/2 neighbor map (CDP/LLDP); explicitly no L3 routing or subnet mapping. [31]
Diagrams: Web-based topology maps with device groupings configurable via config file. Layout requires manual configuration to arrange.
Pricing: Free.
Deployment: Self-hosted on Linux. Requires Perl and PostgreSQL. Docker image available. A self-contained central server polls via SNMP, with no per-device agents.
Where it fits: Network teams comfortable with Perl and Linux administration who want a free, battle-tested tool for Layer 2 discovery and device tracking. Strong at answering "what device is on which switch port?" questions.
Trade-off: Perl-based, which limits the contributor pool. Topology visualization is functional but not modern. Requires Linux, PostgreSQL, and some configuration effort. No service detection beyond basic SNMP data. Mapping is a feature of a broader network management tool, not the primary focus.
Nmap + Zenmap
The go-to tool for one-off network scanning and security audits, not ongoing documentation. Nmap is the standard open-source network scanner. Zenmap is its official GUI, which includes basic topology visualization of scan results.
Best for: Security audits, one-off network discovery, and as the discovery layer in custom automation pipelines
Discovery: ICMP, ARP, TCP/UDP. Port scanning, service fingerprinting, OS detection. Nmap's service detection is thorough: it doesn't just find open ports, it identifies what's running on them.
Network views: The Zenmap topology tab is a traceroute hop graph, not an L2 or L3 map. [17]
Diagrams: Zenmap generates a simple topology view from scan results. Functional for visualizing a single scan, but not a full network diagram tool. For more polished output, export Nmap data (XML) to Graphviz, D3.js, or import into draw.io.
Pricing: Free.
Deployment: Runs on Linux, macOS, Windows, FreeBSD. No server component. Scans from wherever you run it, with no agents on targets.
Where it fits: Security audits, one-off network discovery, and as the discovery layer in custom automation pipelines. If you want to know what's on your network right now and what services are running, Nmap is the fastest path. Pair it with a rendering tool for diagrams.
Trade-off: No continuous updates, no topology mapping (LLDP/CDP), no persistent documentation. Each scan is a snapshot. Zenmap's visualization is minimal. For ongoing, automated diagrams, Nmap is the discovery step, not the whole solution.
Scanopy Community Edition
The best free self-hosted option for automated network documentation. Scanopy CE is the free, self-hosted edition with the same discovery engine as the paid product (SNMP, LLDP, CDP, ARP), an interactive topology map, and service detection. Open source and runs on your own hardware.
Best for: Teams that want automated network documentation on their own infrastructure with no SaaS dependency
Discovery: SNMP, LLDP, CDP, ARP. One daemon, no per-device agents.
Network views: Same engine and four views as Scanopy SaaS; application view is user-defined. [19]
Diagrams: Interactive topology map with service and interface detail. Shareable by read-only link, embeddable via iframe, and exportable as PNG, SVG, PDF, HTML, Mermaid, Confluence, and CSV.
Pricing: Free. Free to self-host, capped at one network and one seat. A commercial license lifts those caps for business self-hosting; managed cloud plans are available too.
Deployment: Self-hosted via Docker, Proxmox, or Unraid. One daemon, no external dependencies beyond PostgreSQL. Same discovery engine as Scanopy SaaS.
Where it fits: Teams that want automated network documentation on their own infrastructure with no SaaS dependency. The free Community edition is AGPL-3.0 and limited to a single network and a single seat; teams that need more take a commercial self-host license or move to the managed cloud plans.
Trade-off: Self-hosted, so you manage updates and the host it runs on. The Community edition is AGPL-3.0 and capped at one network and one seat; a commercial license removes those caps for business self-hosting, with managed cloud hosting as a separate option.
Honorable mentions
Graphviz / D3.js. Rendering engines, not discovery tools. If you've already got network data from another source (Nmap scans, SNMP polls, API calls), Graphviz and D3 can turn it into a diagram. This is the DIY path. Extremely flexible, significant engineering effort required.
Every Capability Claim Here Is Cited to Vendor Documentation, Verified June 2026
Every capability claim in this comparison (pricing, discovery methods, service detection, and which view types each tool supports) is sourced to the vendor's own documentation, with inline citations you can check. I verified the figures in June 2026. Where a vendor's docs don't confirm a capability, I marked it "unclear" rather than guessing. I built Scanopy.
Sources
[2] Auvik - Can Auvik discover services on my network?
[3] SolarWinds - Network Topology Mapper
[4] Paessler - PRTG Pricing
[5] Domotz - Agentless Network Discovery for MSP Client Onboarding
[6] Domotz - Device TCP/UDP Ports/Services Discovery
[7] Domotz - Pricing
[8] ManageEngine - Discover Networks
[9] ManageEngine - OpManager Editions
[10] LibreNMS - Auto-Discovery
[11] Lucidchart - Pricing
[12] NetDisco - Documentation
[13] Paessler - PRTG System Requirements
[14] Domotz - Agentless Network Discovery
[15] ManageEngine - Agentless Monitoring
[16] LibreNMS - Installation Guide
[17] Nmap - Download / Platforms
[18] Scanopy - Documentation
[19] Scanopy - Community Edition
[20] Auvik - Cloud Collector Installation
[21] NetBrain - Discovering and Visualizing Public Cloud
[22] Lucidscale - Automated Cloud Visualization
[23] Faddom - Agentless Application Dependency Mapping
[24] Faddom - Pricing
[25] NetBrain - Discovering and Visualizing Virtualization (ESXi host, vSwitch, VM)
[26] Auvik - How does Auvik discover network topology and device information? (L1/L2/L3, ESXi host-to-VM)
[27] ManageEngine OpManager - Layer 2 Maps
[28] ManageEngine OpManager - VMware Monitoring (host-to-VM, VM-to-datastore maps)
[29] Domotz - Network Topology Mapping (VLAN/subnet, L2/L3)
[30] LibreNMS - Network Map (Layer 2 links via xDP and ARP)
[31] NetDisco - Network Map (layer1/layer2, not L3 routing/subnets)
[32] Paessler - PRTG has no native Layer 2 topology mapping (use UVexplorer)
[33] Lucid - Lucidscale cloud visualization (cloud-only, no on-prem topology)
[34] NetBrain - Dynamic Map (Layer 2 and Layer 3 topology)
[35] NetBrain - Visualize VMware vCenter Networks (ESXi host and VM relationships on dynamic maps)
[36] NetBrain - Mapping Application Dependencies (A/B Path traffic-flow map)
[37] Auvik - Network Topology Mapper (visualizes physical wiring, VLANs, VMs, containers)
[38] ManageEngine OpManager - Virtual Maps (Host-to-VM, Host-to-Datastore)
[39] Auvik - VMware hypervisor dashboard (VMs listed in a dashboard, not a host-to-VM nesting map)
[40] NetBox - Network Source of Truth (DCIM and IPAM)
[41] NetBox - Topology visualization via community plugin (netbox-topology-views)
[42] NetBox Labs - Pricing (Cloud and Enterprise contact sales)
[43] NetBox - Open source (Apache-2.0), GitHub
[44] SolarWinds NTM - Pricing (TrustRadius)
Frequently Asked Questions
What are network documentation tools?
Network documentation tools keep a current, accurate record of your network: the devices on it, how they connect, and the services running on them. The automated kind discovers this directly from the network over protocols like SNMP, LLDP, and ARP and updates it on a schedule, instead of relying on someone to maintain a spreadsheet or diagram by hand. The output is usually a topology map plus a searchable inventory.
Do network documentation tools replace IT asset management or monitoring?
No. Documentation tools record what exists and how it connects. Monitoring watches device health and alerts on problems, and IT asset management tracks ownership, licensing, and procurement. The three overlap on the device inventory but answer different questions, and most teams run them alongside each other rather than one instead of another.
What is the difference between a network diagram tool and a network monitoring tool?
A network diagram tool discovers devices and connections, then produces a visual topology map. A monitoring tool tracks device health, bandwidth, and alerts over time. Some monitoring platforms (Auvik, PRTG, Domotz, ManageEngine) include basic mapping as a feature. Dedicated diagram tools (Scanopy, SolarWinds NTM, NetBrain) focus entirely on producing accurate, shareable maps without bundling monitoring.
How often should automated network diagrams be updated?
It depends on how often your network changes. Scanopy runs scheduled scans (hourly to daily), while tools like Auvik and Domotz poll continuously. SolarWinds NTM runs on-demand scans. For most IT teams, daily or weekly updates catch device additions and topology changes. Environments with frequent changes (cloud, DevOps) benefit from more frequent scan schedules.
Can network diagram tools discover cloud infrastructure?
Some can. Lucidscale (part of the Lucid suite) imports AWS, Azure, and GCP topology via cloud APIs. NetBrain and Auvik offer cloud API connectors for hybrid on-prem/cloud maps. Most on-prem-focused tools (SolarWinds NTM, PRTG, Domotz, LibreNMS, NetDisco) only discover devices reachable via SNMP, LLDP, or ARP on local networks.
Do I need SNMP enabled for automated network discovery?
For most tools on this list, yes. SNMP provides device identity, interface details, and neighbor relationships via LLDP/CDP. Without SNMP, discovery is limited to IP-level scanning (ping sweeps, ARP). Nmap can identify services via port scanning without SNMP, but topology mapping relies on SNMP neighbor tables for accurate connection data.
What is the most common reason automated network diagrams are inaccurate?
Incomplete SNMP coverage. If SNMP is not enabled on all managed devices, or if community strings are misconfigured, the tool only sees a partial network. Other common causes include firewalls blocking discovery traffic, unmanaged switches that do not respond to SNMP, and stale ARP caches on routers. Running a manual spot-check after initial discovery helps identify gaps.
How do network diagram tools handle VLANs and subnets?
Tools using SNMP and LLDP/CDP can discover VLAN assignments and map devices to subnets automatically. SolarWinds NTM, NetBrain, and NetDisco are particularly strong at Layer 2 topology including VLAN boundaries. Monitoring-focused tools like Auvik and PRTG show VLAN data as part of device detail but may not visualize VLAN segmentation as a distinct diagram layer.
Started as a homelabber, now deep in SNMP MIBs, Layer 3 topology, and service fingerprinting - building the network documentation tool I wished existed.